
Abstract
What are Storm Surges? They are a rising of the sea as a result of atmospheric pressure changes and wind associated with a storm. In this project, I analyzed the potential impact of such a phenomenon in Metro Vancouver. Storm Surge can reach up to 8m in height, and because of climate change, extreme weather event happens more frequently than ever.
Accomplishment Statement
From this project, I gained practical knowledge of how to operate Arc GIS and GIS in a broader term. Especially, I learned the difference between the vector file and raster dataset. It was intriguing that we can create a hazard map based on elevation and land usages. For Arc GIS, I learned how to calculate area and distance, how to buffer, modifying the symbol and converting raster data into vector data.
Project Description
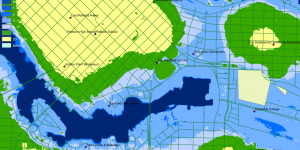
- In this analysis, I used the digital elevation model (dem92, resolution: 25*25m) for Metro Vancouver and classified the land into 8 categories by elevation. By highlighting the lower elevation within Metro Vancouver, I mapped the total area threatened.
Map1_Flooding_Prone_Locations_MetroVancouver_map
2. I buffered coastal and riverside area because those lands are especially prone to flooding.
Map2_Flooding_Proximity_Analysis_map
3. Next, to examine the affected roads, I inserted the road layer. Highlighting expressways and high ways, the map clearly shows where would experience traffic disruption and possibly, map readers can analyze how it would affect the whole transportation network.
Map3_Flooding_Roads Affected_map
4. Lastly, I examined the new location of St Paul’s hospital to warn that it locates at relatively low elevation near the coast. It locates in potential flooding area. I examined False Creek Area specifically with DEM that was taken from LIDAR with the resolution of 1*1m. Also, safeness of public institutions in False Creek area is examined and there aren’t any schools which fall into flooding prone locations; however, some locates very close to the zone and may require additional care.
Map4_Falsecreek_Flooding_Assessment_map
Acknowledgment
Potential error for this project and maps include a less accurate representation of elevation (especially outside False Creek where I was forced to use 25*25m resolution DEM due to lack of data), rough reading of data and representation of the shape for the new hospital can be different from the reality.
Analysis
According to my spatial analysis, entire Richmond and Coastal side of Delta have low elevation, making them prone to storm surge. Also, the airport (YVR) will be hit. Since many major routes such as expressways and highways are affected too, we can guess that in storm surge scenario, traffic network will be severely disrupted. In fact, the potential total length of expressways and highways affected by flooding is 1695.61 km. For False Creek, as I mentioned above, new St.Paul's hospital does not locate in the safe zone making it fragile for extreme weather events. Also, there are no schools located within definite flooding zone but Elsie Roy Elementary, False Creek Elementary, and Crosstown Elementary are very closely located to the zone, so they need additional attention when storm surge occurs.
Data set
| Layer Name | Description | Raster/Vector | Feature class | Attributes | source |
| dem92g | DEM, 25m resolution | Raster tiff | Value (elevation) | Open data Canada | |
| fcdem1m | DEM, 1m resolution, resamples from .5m | Raster tiff | Value (elevation) | City of Vancouver | |
| shoreline | Outline of Metro Vancouver | vector | line | n/a | Statistics Canada |
| roads | Roads in Metro Vancouver | Vector | line | Road_type | CanMap |
| education | Schools in Metro Vancouver | Vector | point | Name, type | CanMap |
| van_schools
(download, not in Getdata) |
Public schools in the City of Vancouver | vector | point | City of Vancouver |
Learning Significance