
About
In the modern age, we can conduct spatial analysis for a variety of purpose by retrieving data from Census Tracts and Census Dissemination Area which are all available to the public, published by Statistic Canada. In this project, I analyzed the cost and affordability of housing in two different cities - Vancouver and Montreal.
Learning Accomplishment
Operating ArcGIS and understanding different classification and their meaning.
Also, what I learned is the significance of data misrepresentation. I mean there are so many variables to consider when making maps otherwise we make errors knowingly or unknowingly. To make the most authentic maps, informing possible errors are very important. Maps are a simplified version of the world and not perfectly projecting the reality, thus there are always insufficiencies or discrepancies in the map to warn the readers.
For example in map 1if I was an agent who sells real estate near UBC, I would use standard deviation. This because classifying with standard deviation differentiates the area relative to price more than any other map. Other maps have too much area of maximum value classification (deep red) so that the relative difference between the property zone is unclear. We know it’s expensive, but compare to other locations, how much more expensive it is? This is the critical question and should represent in the map if somebody wants to do their business ethically.
Project Description
- Downloading Data
First, I downloaded the housing cost and income data for Metro Vancouver and Montreal with Census Tracts (CT) and Census Dissemination Area (DA) from the library of UBC.
2. Quantitative Data Classification
From the data, I gathered for Vancouver, I made maps that are represented in different Data Classification models: Standard deviation, Natural breaks, Equal interval, and Manual breaks. The process of turning tabular data into geocoded shapefile was pursed by the help of Relative Data Base Management System (RDBMS). It explains how the data relates to each other and enables "join" operation in Arc GIS.
Map1_Vancouver_Affordability_Data_classification
*In this map "Shelter Cost" means the average value of dwelling cost within one Census Tracts area.
3. Comparing two cities
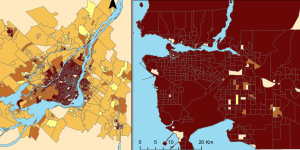
I compared the house cost and its affordability difference between Vancouver and Montreal.
Map2_housecost_comparison_Vancouver & Montreal
Map3_Affordability_Comparison_Vancouver & Montreal
Analysis
Based on my spatial analysis and the maps, we can see that Vancouver's housing price are out of the roof; most people cannot afford to buy a house in this area. Compare to Vancouver, Montreal is much more affordable. In the Map3, we need to use Manual breaks and not natural break because when we represent housing price and compare two different cities, a common measure between two of them is necessary. Natural Breaks would give individual high and low values but not unified measure, thus the colour of the map wouldn’t have meaning. The presentation becomes meaningful only when we compare with the same scale. That is why we need to conduct with the same manual breaks.
Data Certainty
Statistic Canada suppresses data whenever the value is below a threshold of certain measurements. In housing costs scenario, some dwelling costs are marked 0. This is not abnormally in the statistic (Census Tracts), but it simply has no data input. These locations are often indigenous land or other reasons related to social welfare.
- In Vancouver, using Census Tracts(CT), there are 19 shelter blocks that are marked 0 and it represents 4% of whole data.
- By using Census Dissemination Areas(DA), there are 22 values that are marked 0s which represent 0.6% of whole data.
Census Tracts (CTs) and Census Dissemination Areas(DAs)
Census Tracts (CT)>
- CT population should range between 2500 and 8000 (preferred average of 4000)
- CT should be homogenous as possible in terms of socioeconomic status
- CT boundaries must follow easily recognizable physical features
- CT should be compact as possible
Census Dissemination Area (DA)>
- DA conduct according to census subdivisions and census tracts (remain stable over time)
- DA follow roads, railways, water features, power transmission lines (major geographical lines)
- DA is uniform in population size (compact in shape too)
Differnces>
- CT update their stats every 5 years as opposed to DAs the last update was in 2011.
- CTs represent metropolitan area more concisely but it has not reached to the rural side of Canada, as opposed to DAs covering entire Canada. DAs also have smaller population unit than CTs.
Also, to assess affordability, I used “Median Multiple” = median house price divided by median annual gross pre-tax household income
Affordable – 3 and under Moderately Unaffordable 3.1 to 4 Seriously Unaffordable 4.1 to 5 Severely Unaffordable 5.1 and over